During the S/4 MOVEtoRISE conversion project, we proposed to Maison Johanès Boubée (MJB) that they use the new SAP monitoring solution based on the SaaS Cloud ALM tool. We were to use the monitoring application to monitor the overall health of the SAP system, the successful execution of jobs, and the interfaces running within the SAP Cloud Integration Suite.
We have therefore decided to implement the following three scenarios from the Operation module:
Health Monitoring
The system’s watchdog.
This module monitors the overall health of the SAP environment in real time: performance, availability, resource usage, critical errors… In short: it identifies early warning signs before they escalate into major incidents.
Job & Automation Monitoring
The SAP job monitor.
It tracks the execution of all automated processes (batches, scheduled jobs, automations) and detects delays, failures or anomalies. The result: no more unpleasant surprises in the morning – everything is under control (and alerts are sent if necessary).
Integration & Exception Monitoring
The system
integrator analyses data exchanges between SAP and other applications (interfaces, IDocs, Integration Suite flows) to identify errors and blockages. When a business process gets stuck, the team is notified immediately and takes action before it affects the business.
We will now look at the results of these various implementations.
Health Monitoring
Real-time monitoring of the overall health of the SAP environment.
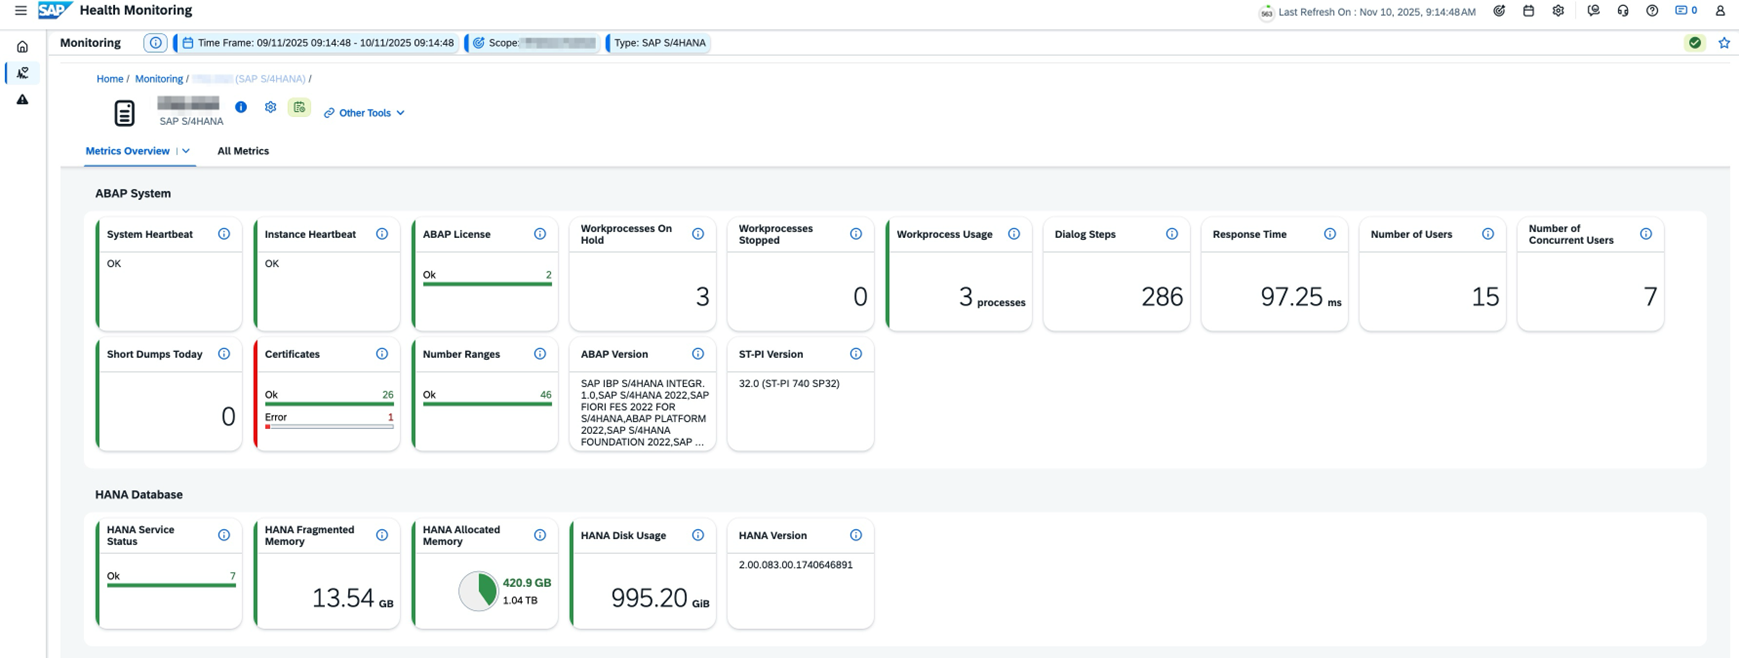
Ecran d’accueil :
Afin de disposer d’une vue synthétique de l’ensemble des métriques de santé du système SAP.
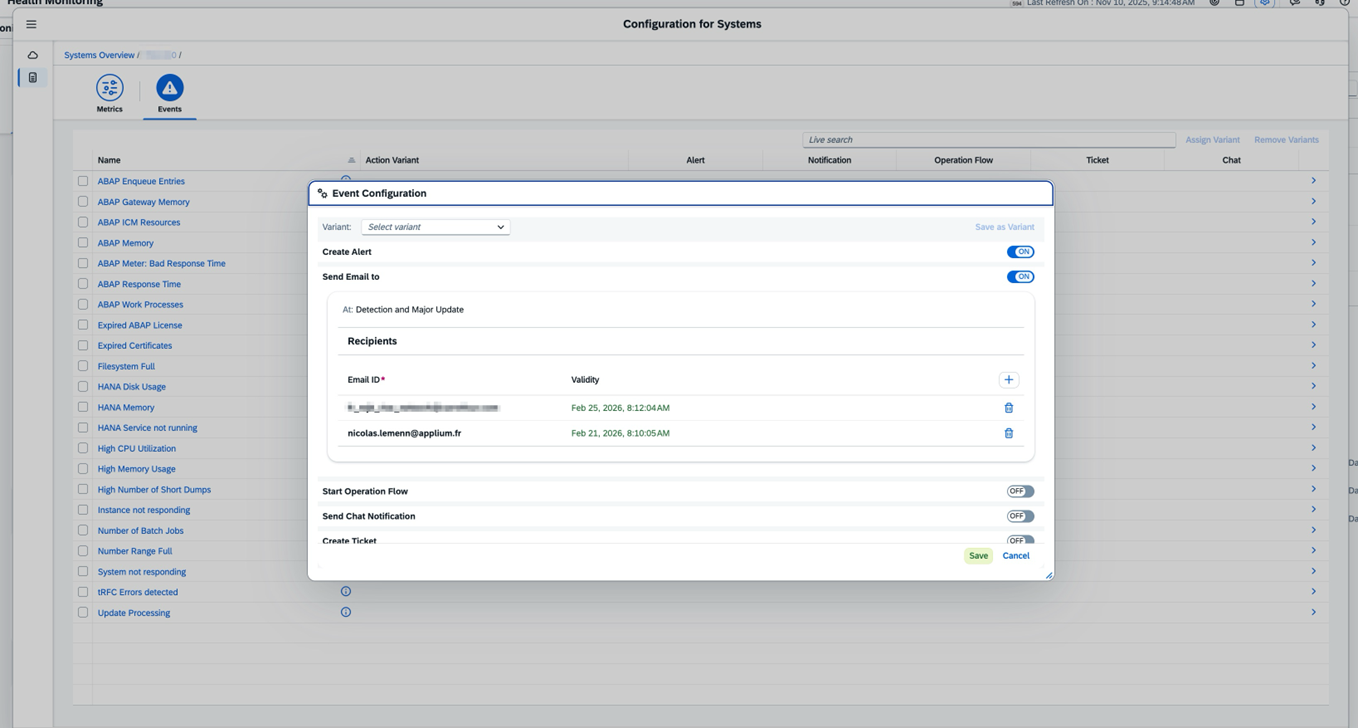
Configuration des alertes par mail :
Afin d’être alerté en temps réel sur les erreurs de santé du système SAP.
Job & Automation Monitoring
Monitoring of all automated or background processes.
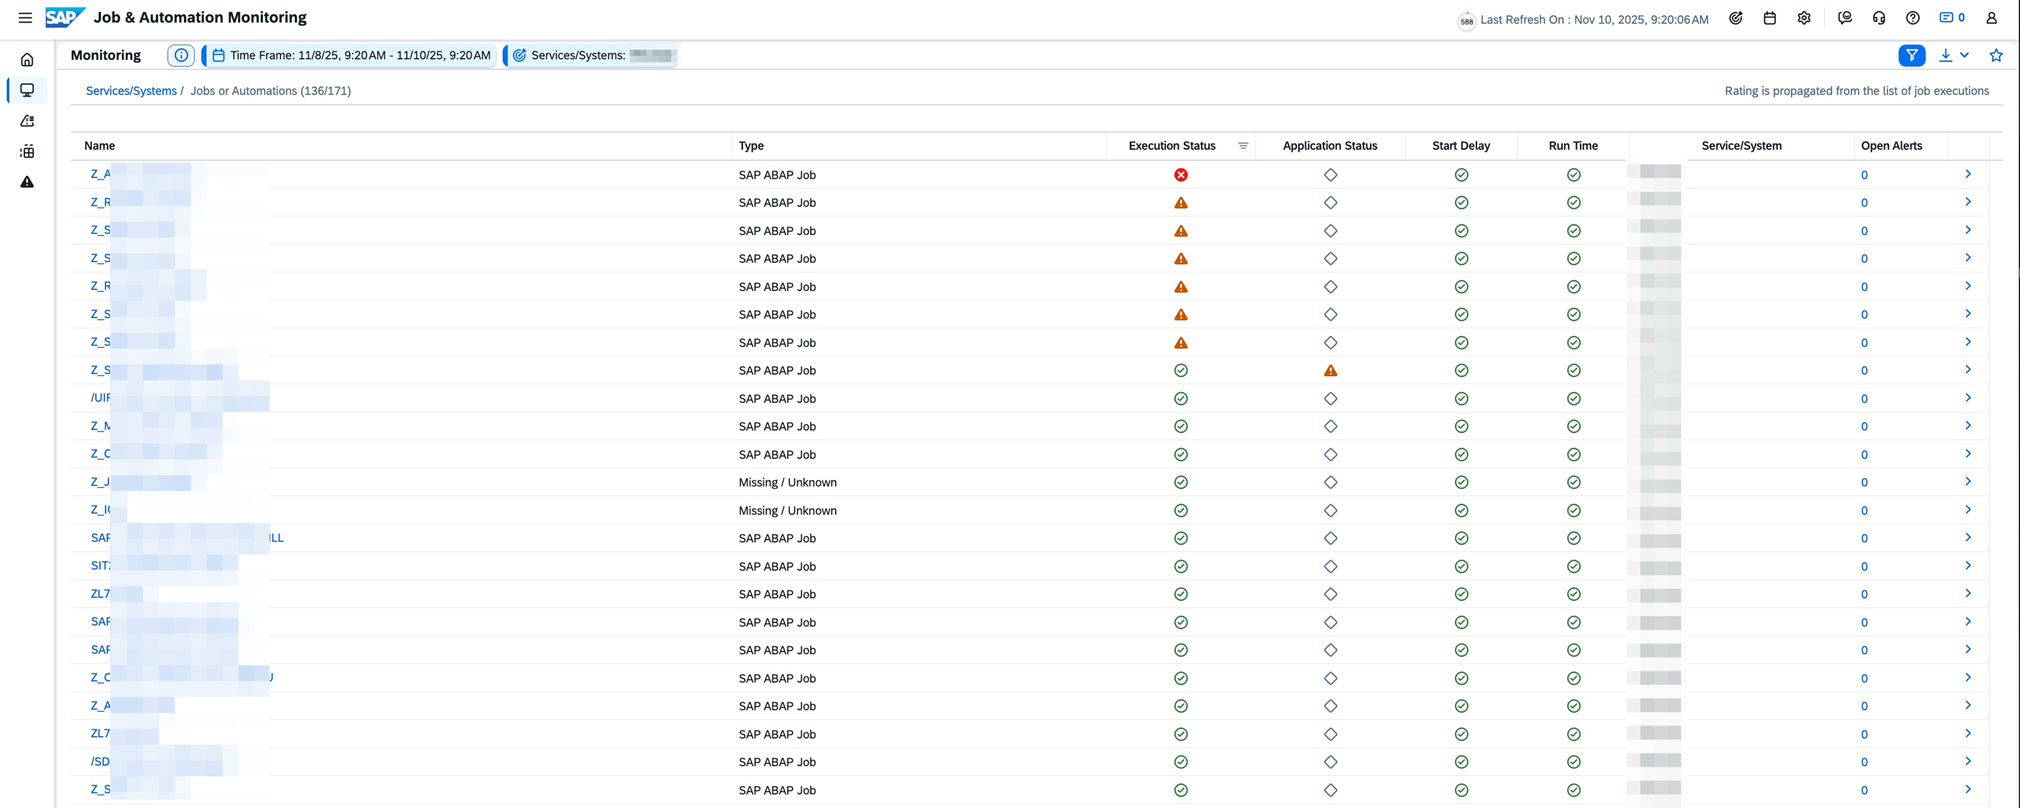
Ecran d’accueil :
Pour avoir une vision claire des anomalies rencontrées sur les jobs SAP.
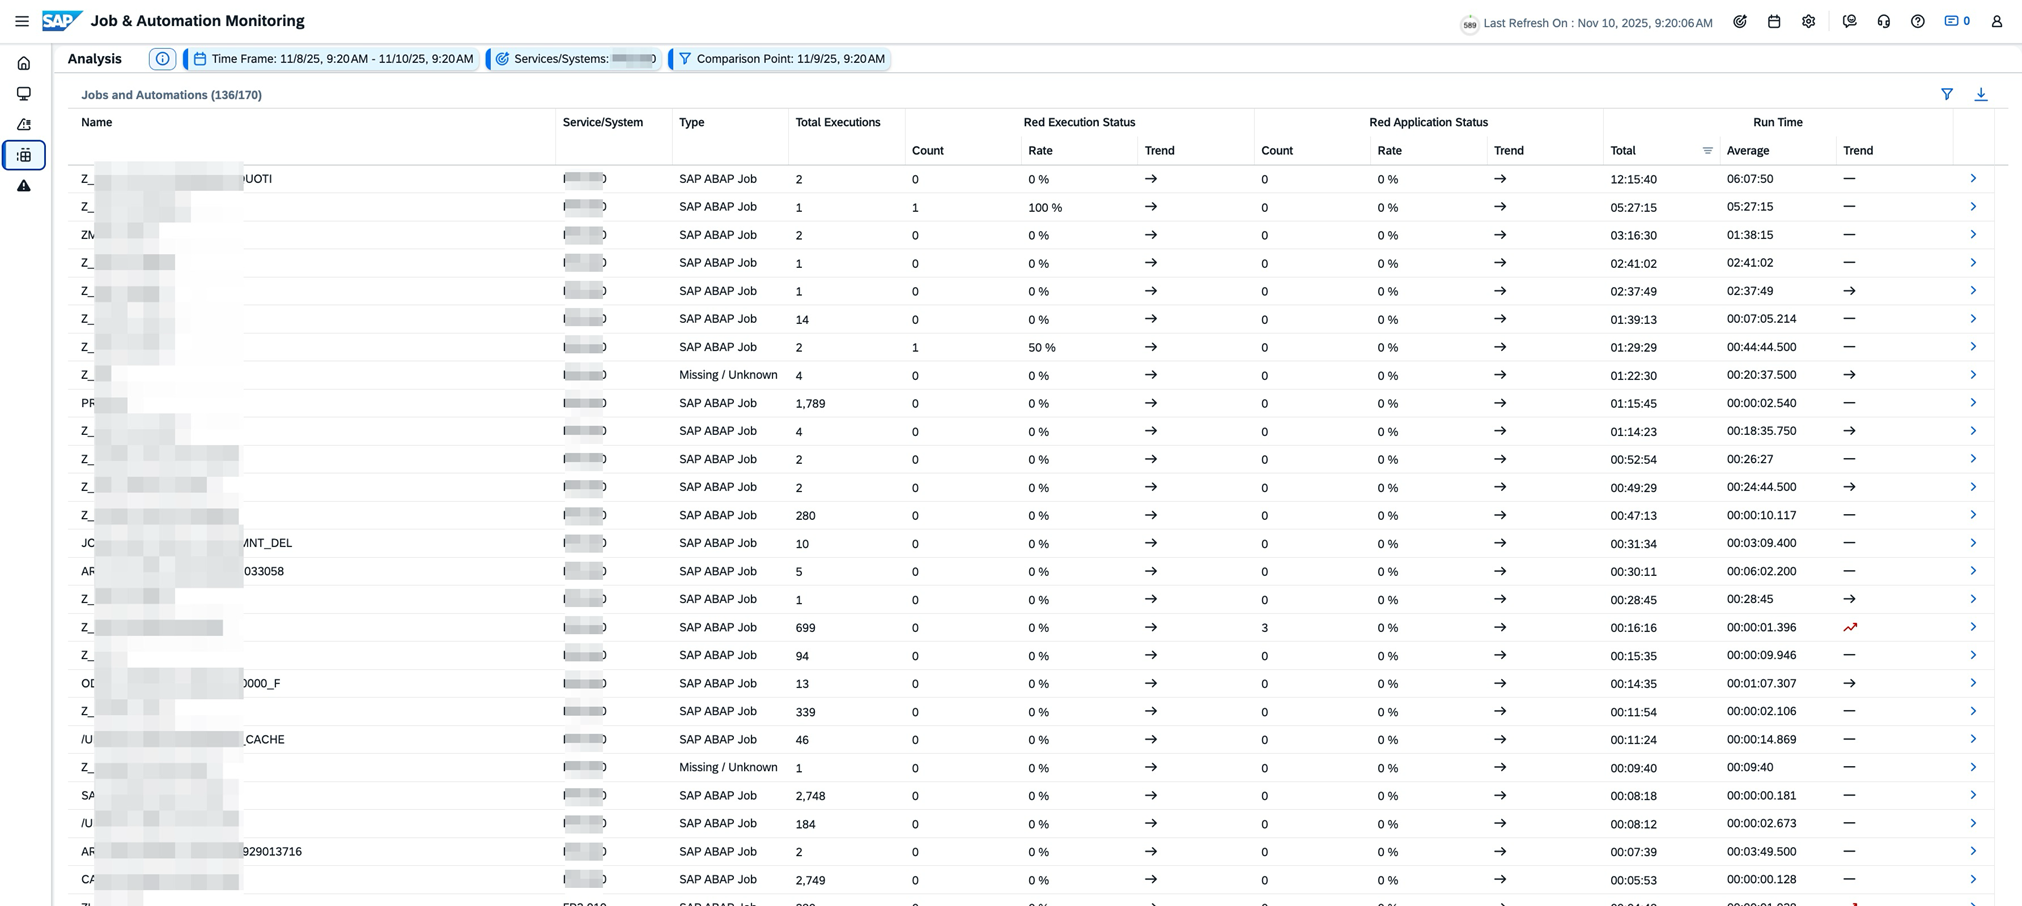
Ecran d’analyse :
Lorsque l’on souhaite pousser l’analyse sur certains jobs et voir l’évolution de leur comportement dans le temps (répétition des erreurs, augmentation du temps de traitement, …).
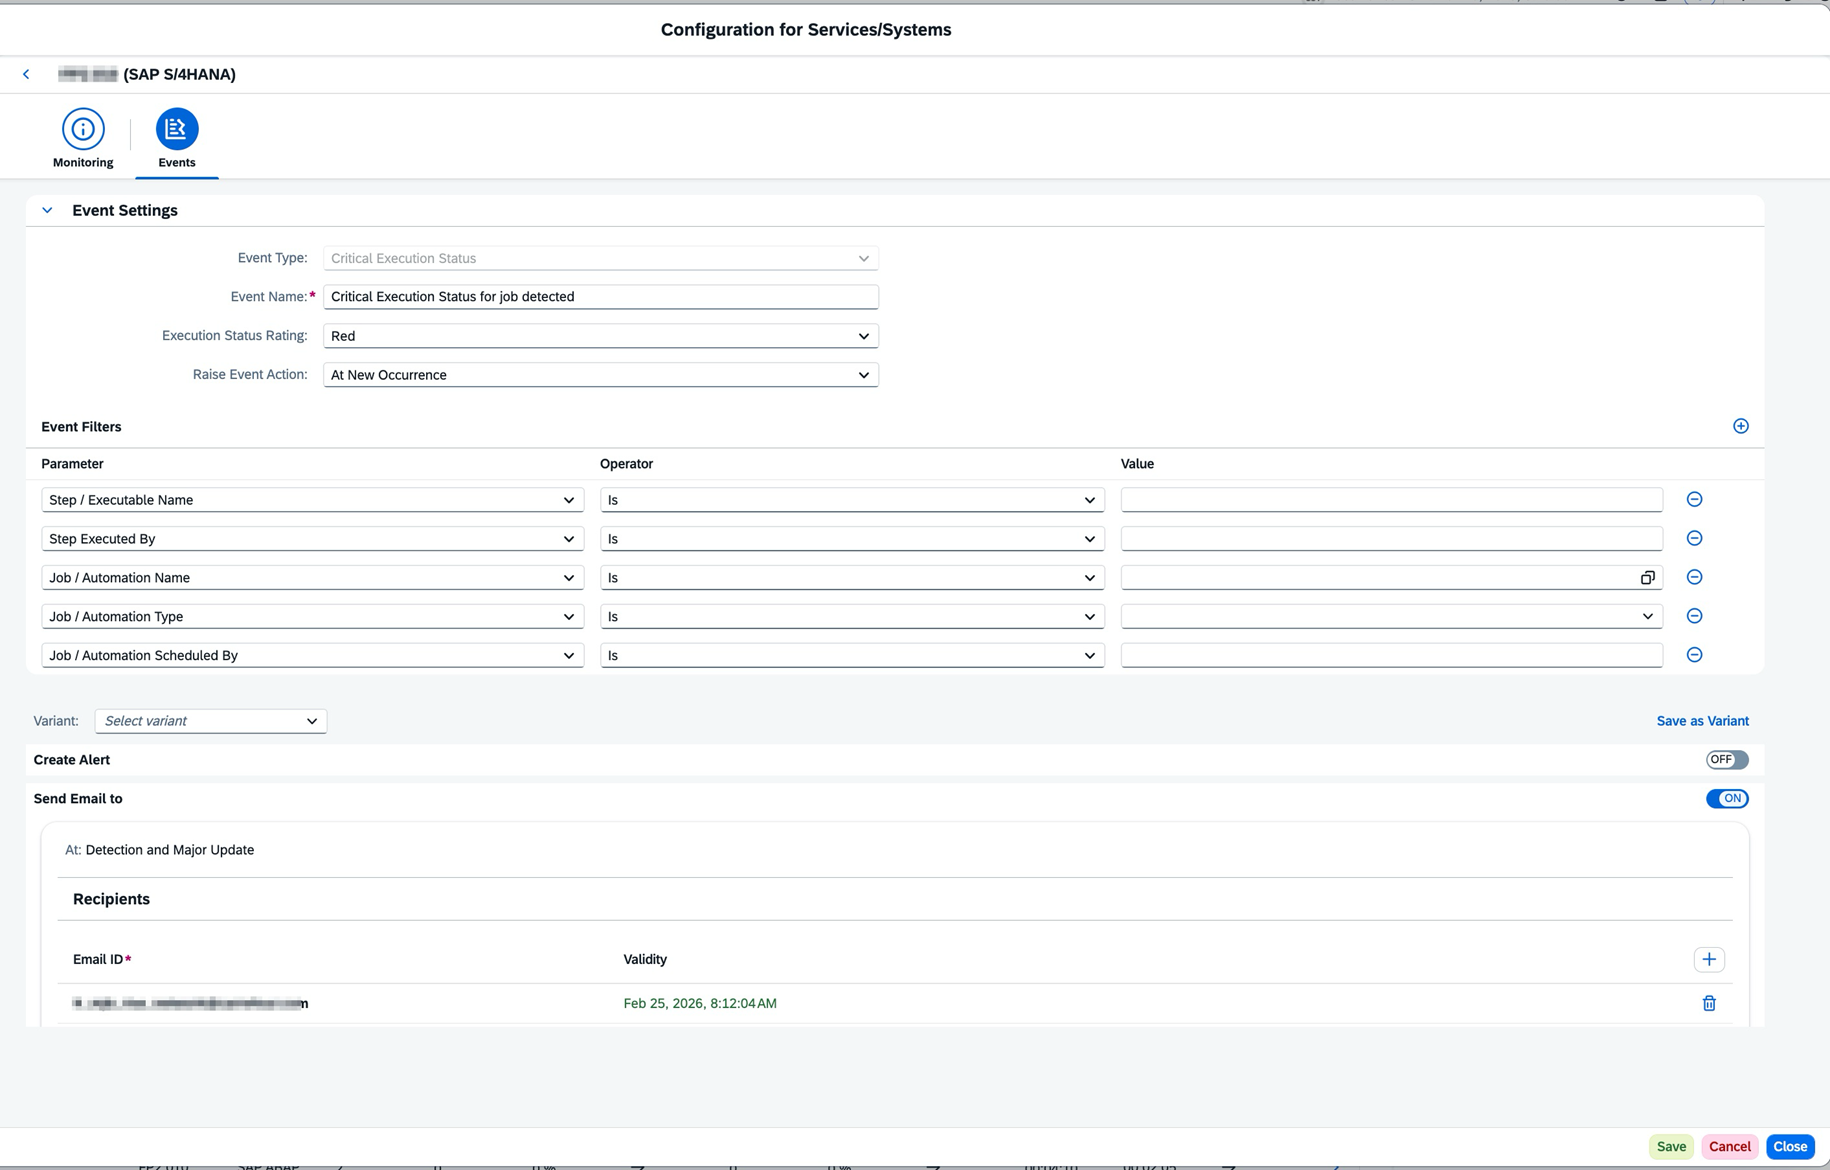
Configuration des alertes :
Pour être prévenu en temps réel pour chaque job en erreur :
Integration & Exception Monitoring
Monitoring of all interfaces and application logs.
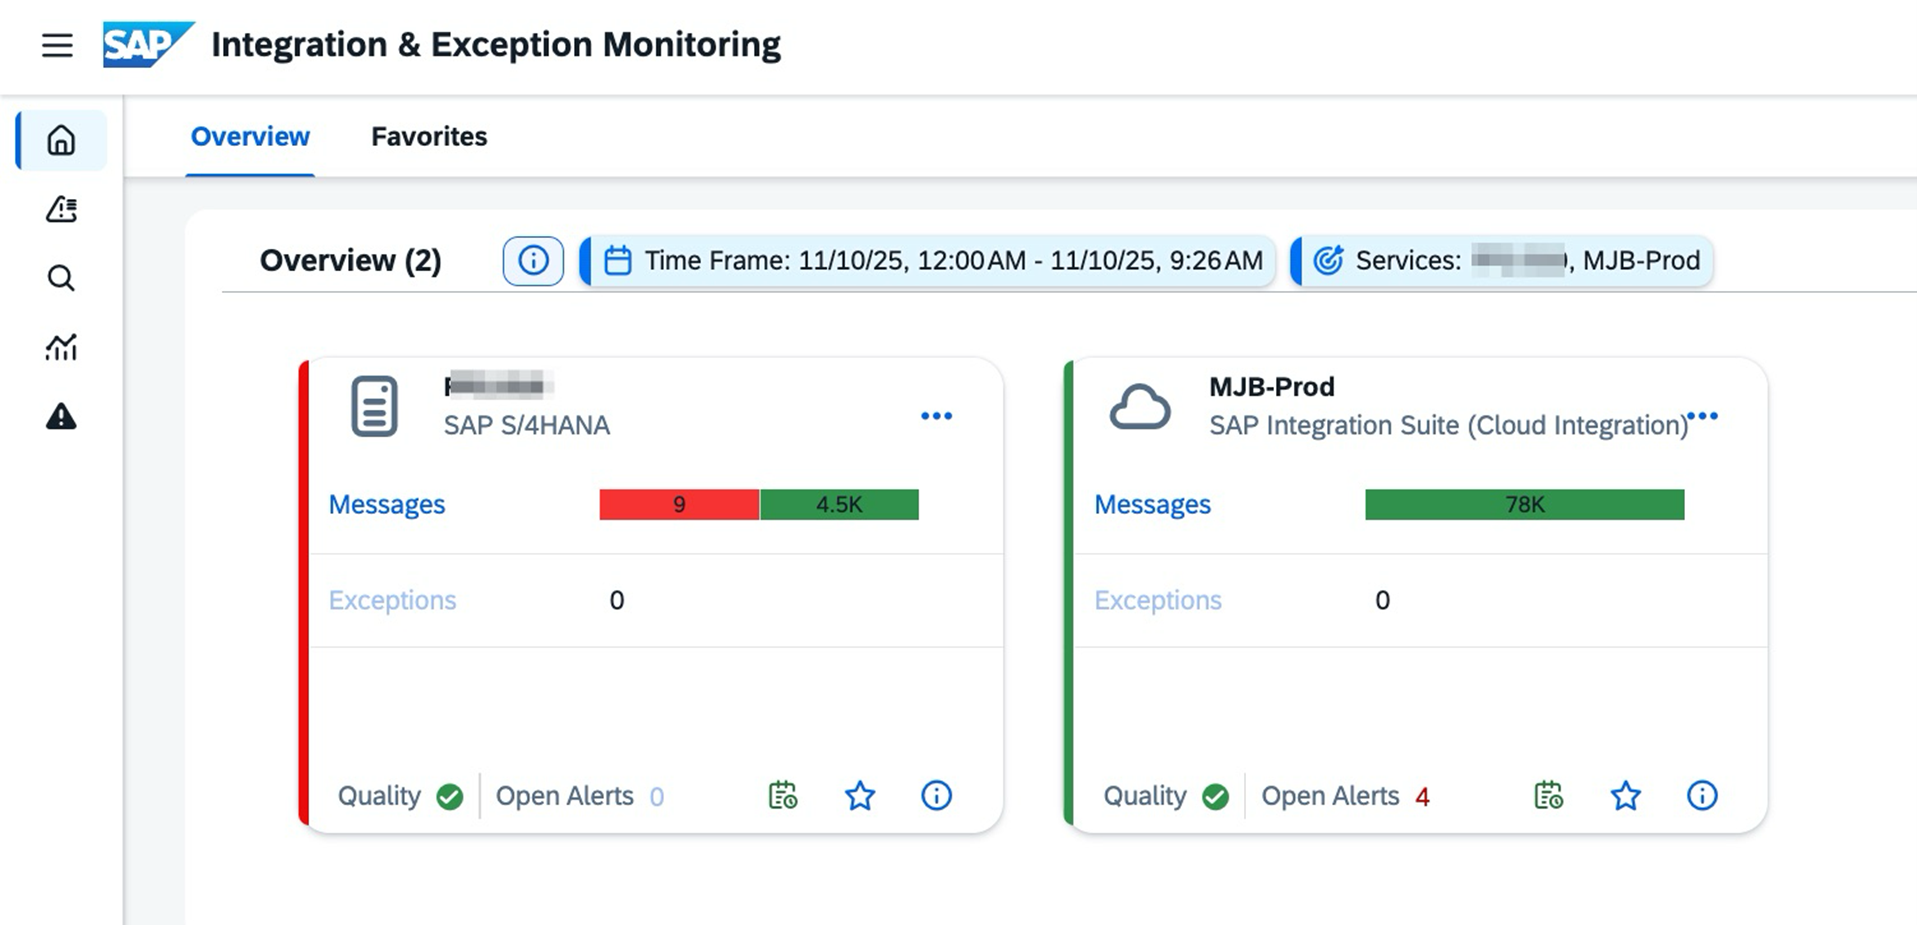
Ecran d’accueil :
Avec la vue synthétique sur l’environnement S/4 et la solution Integration suite qui sont les 2 environnements sur lesquels les interfaces doivent être monitorées.
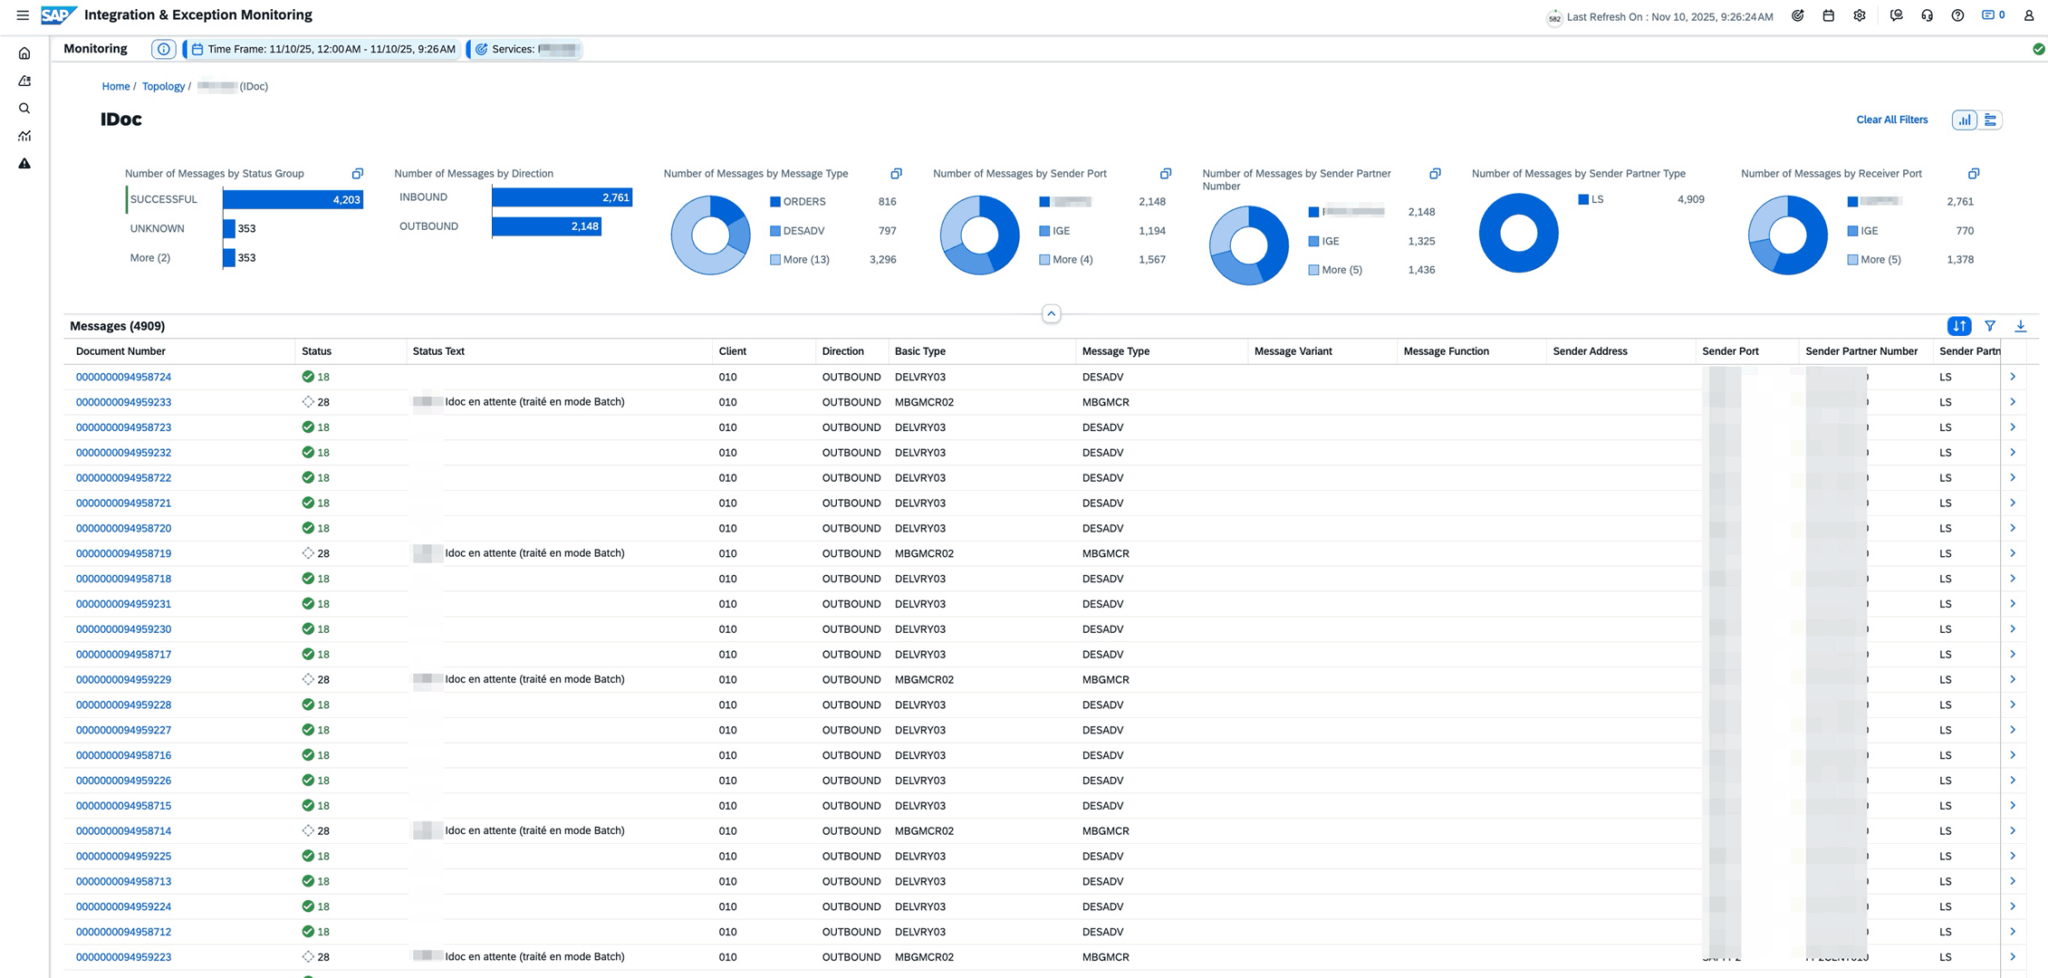
Supervision temps réel des Idocs dans le système S/4 :
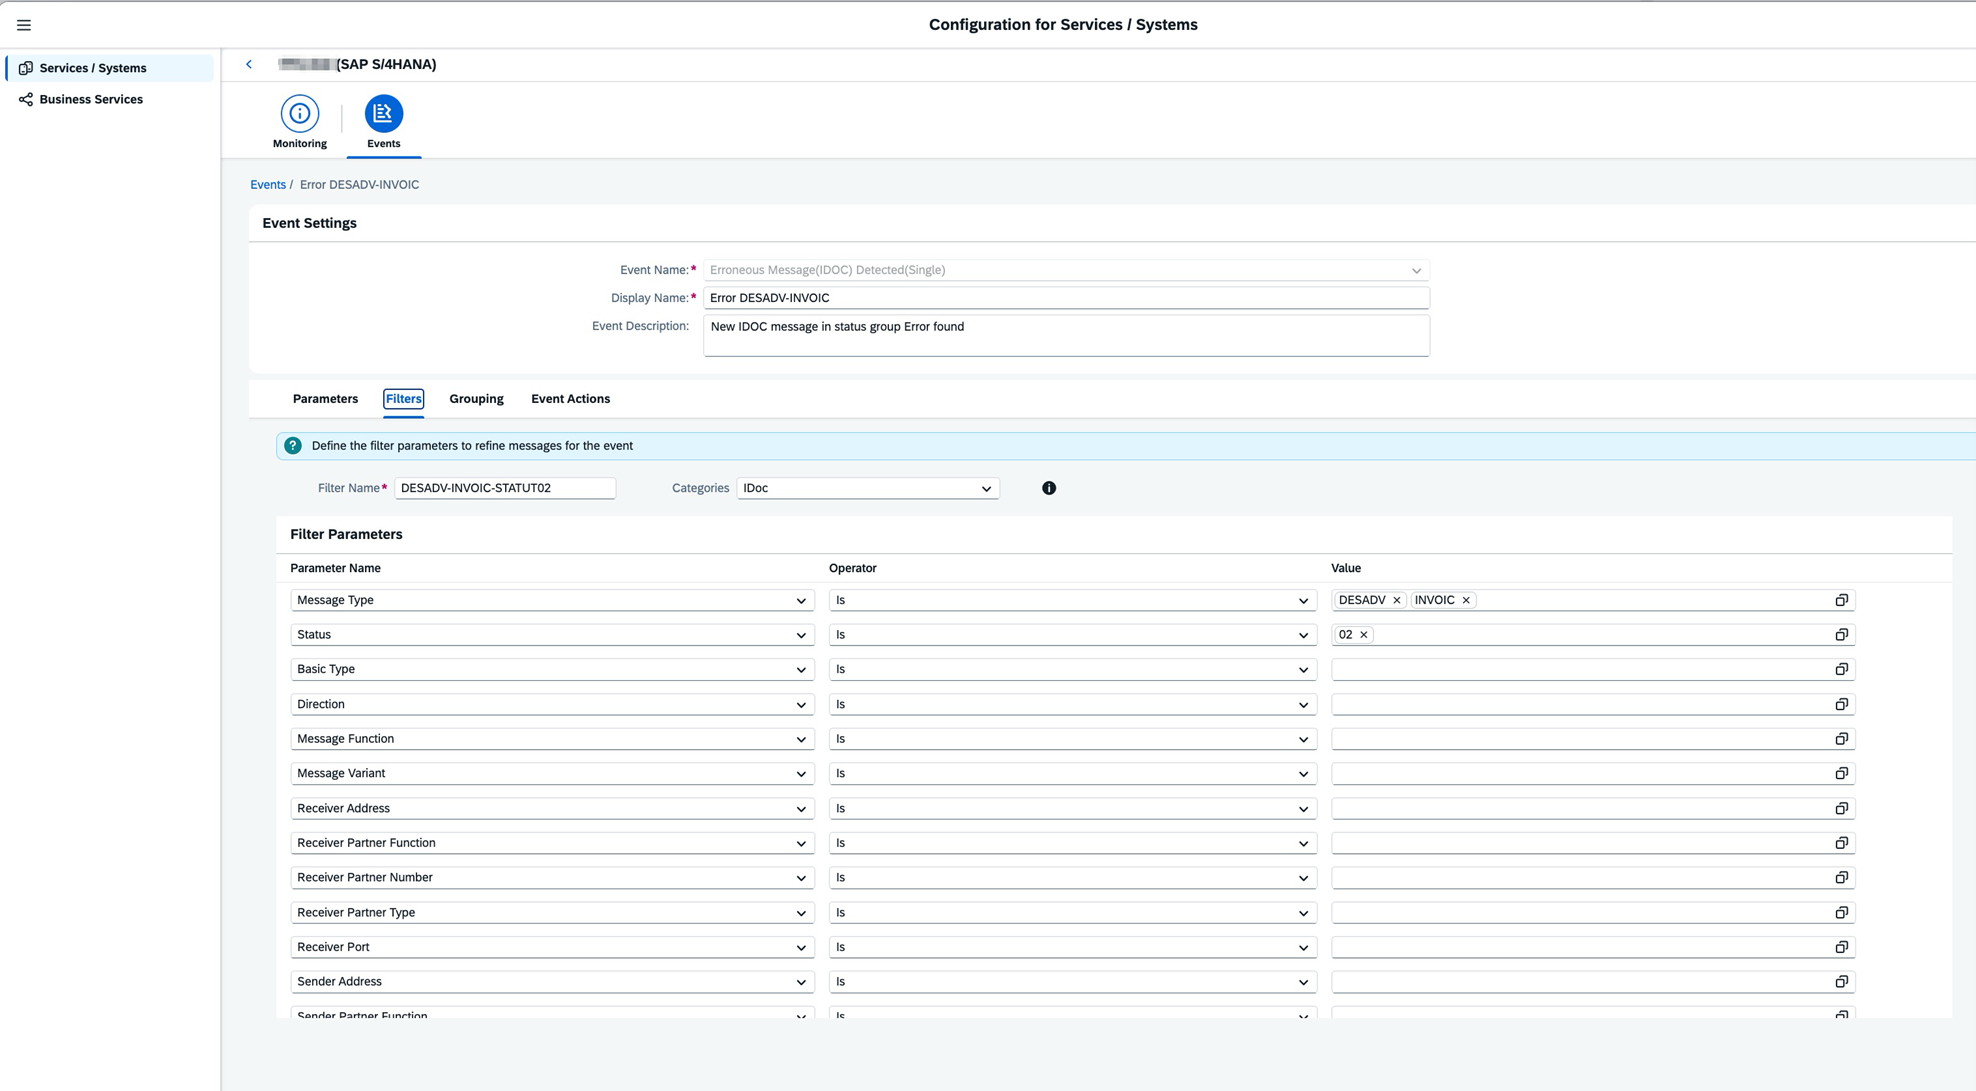
Configuration d’une alerte spécifique bloquant les flux métier :
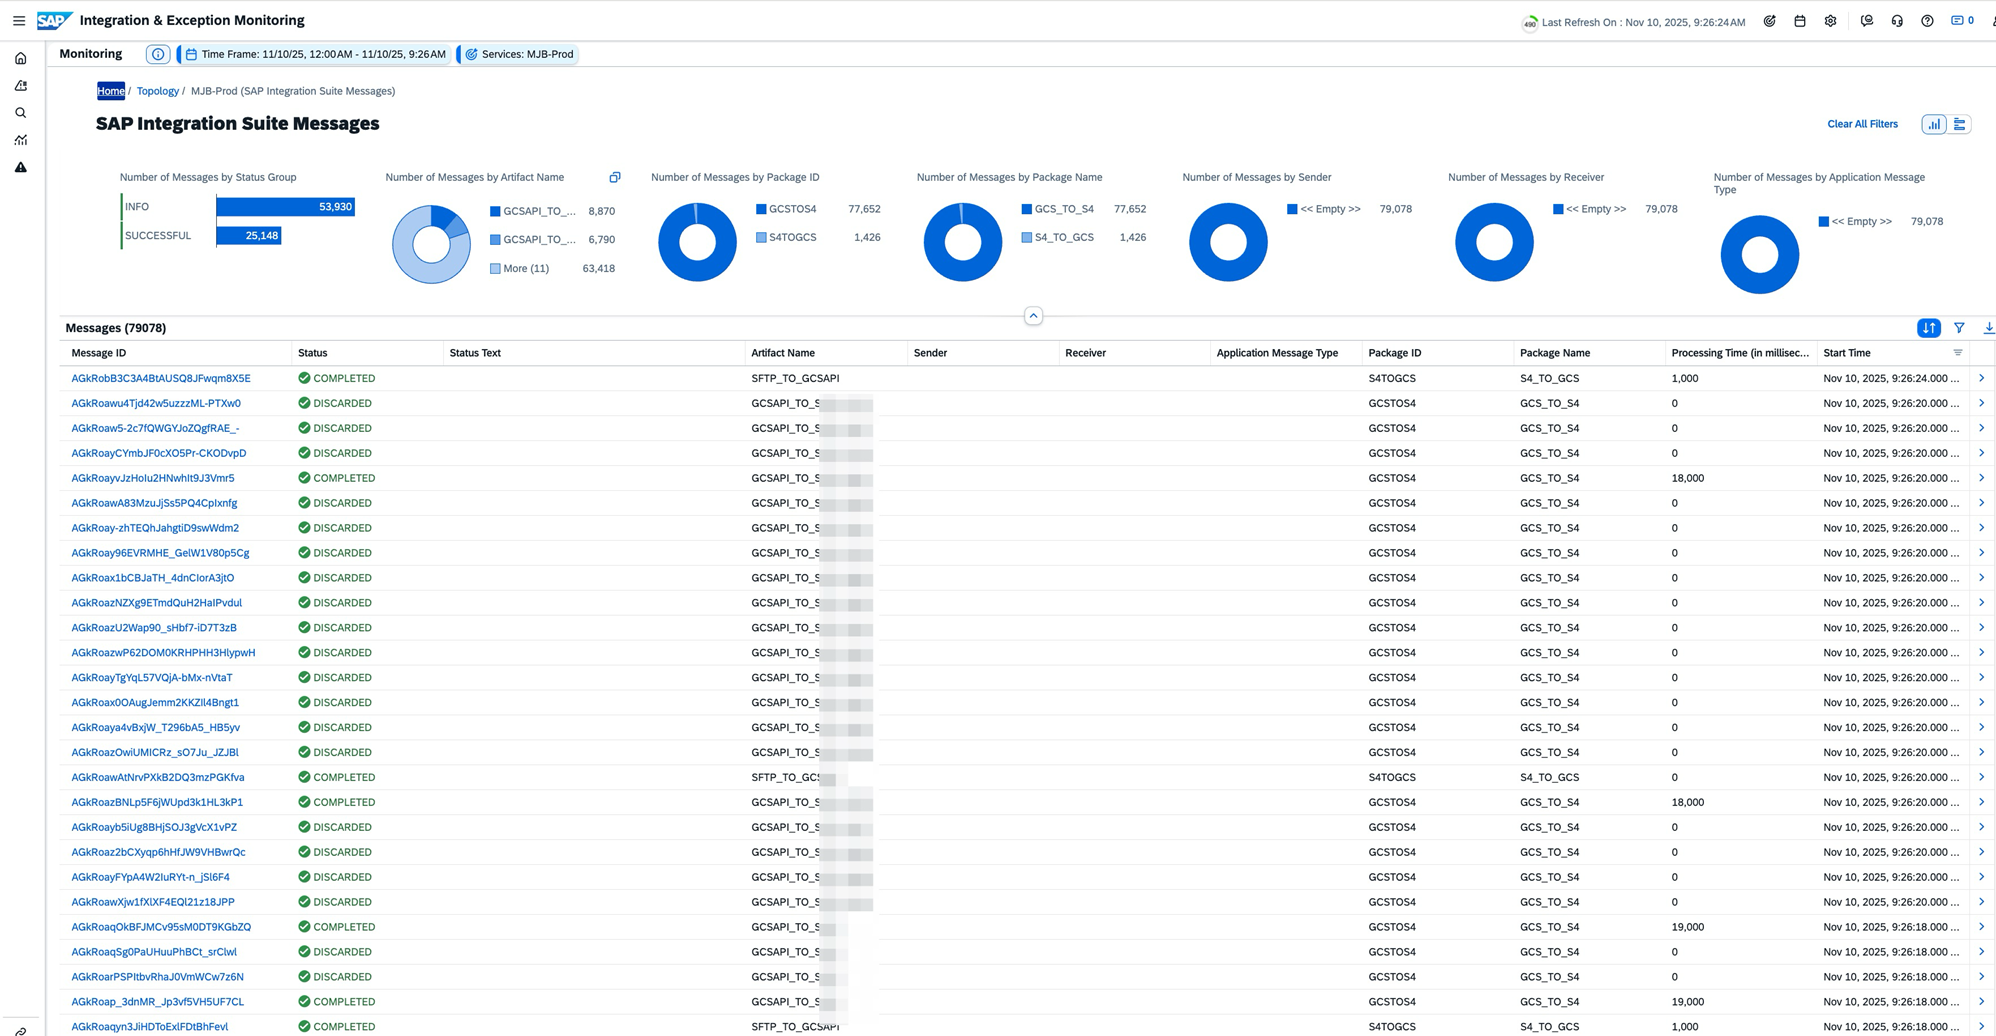
Supervision temps réel de l’ensemble des flux Integration Suite :
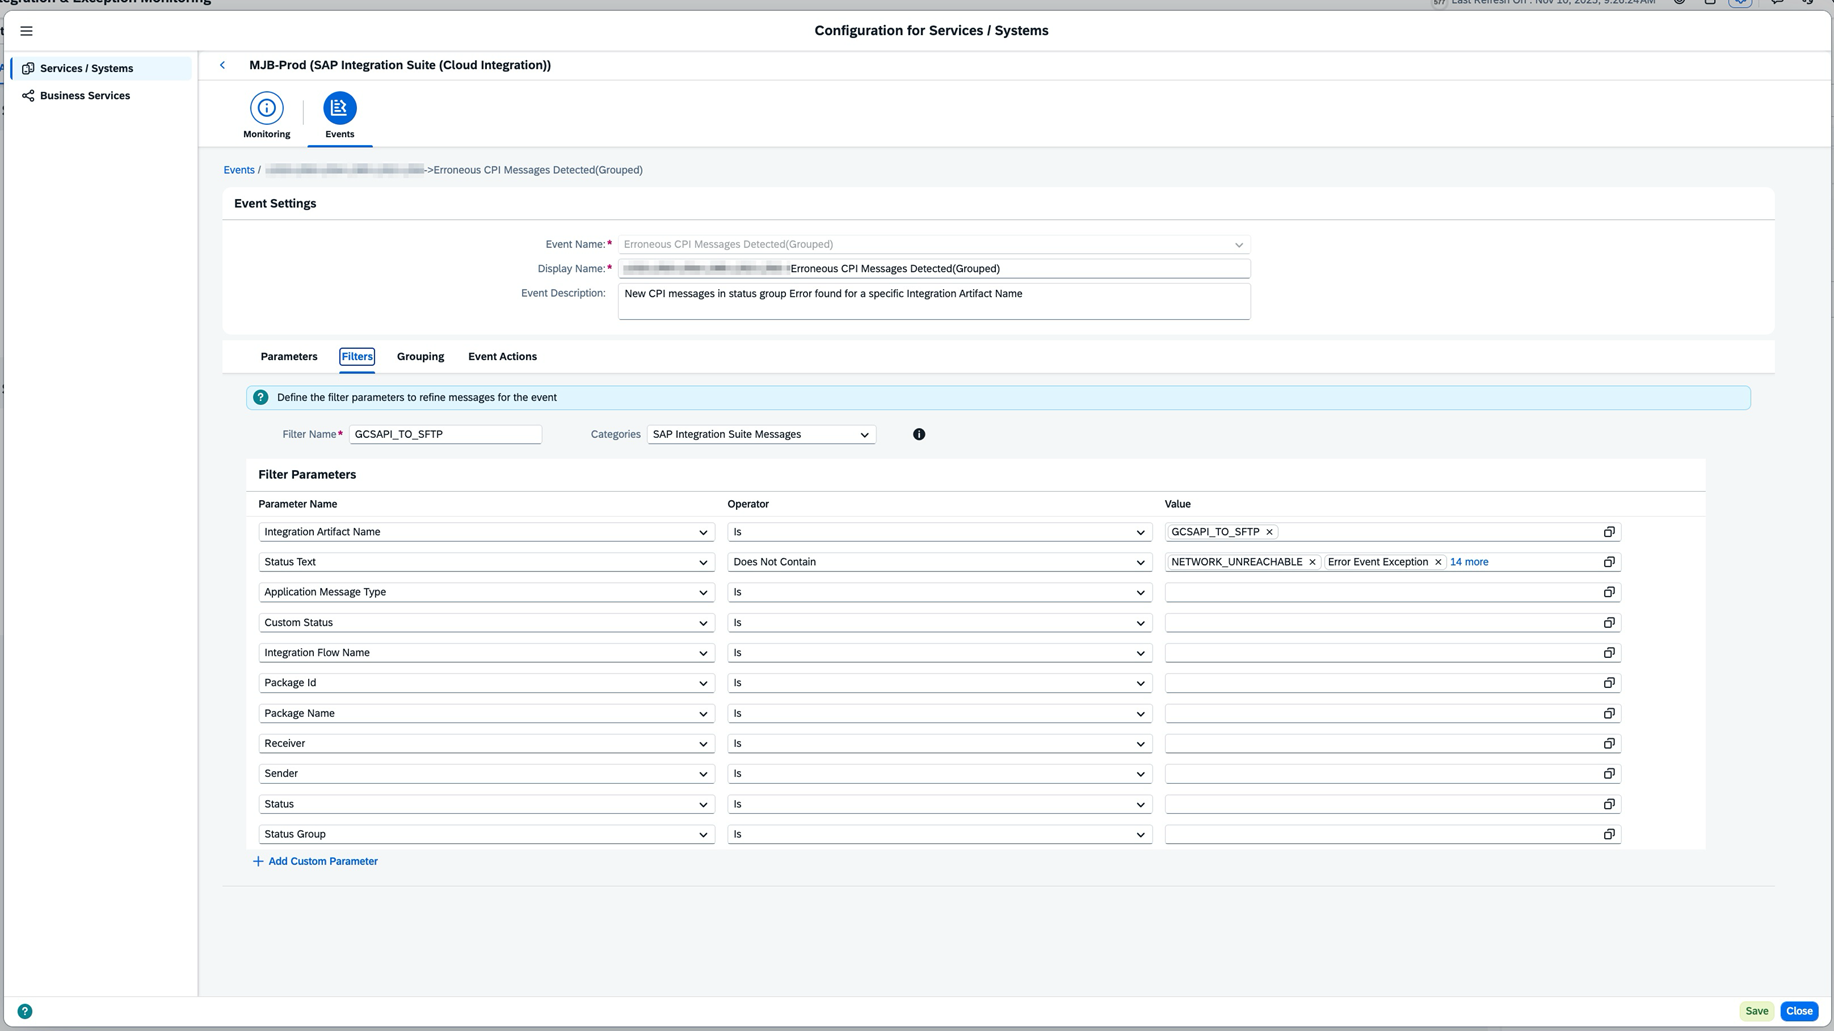
Configuration des alertes :
Filtrées sur les erreurs non pertinentes ou bloquantes pour les flux, afin d’être alerté en temps réel de tout dysfonctionnement des interfaces.
Thanks to these three scenarios, MJB now has a system for monitoring critical points. We have also set up automatic email notifications to MJB’s mailing lists and our ticketing system, to ensure that detected incidents are tracked and resolved.